Introduction
RootDetection is an automated tool for evaluating photographs of plant roots.
It detects single strand roots, traces their paths and measures the resulting lengths - completely automatic.
All results are written to an embedded database (SQLite) and can be exported as MS Excel compatible CSV files.
RootDetection also provides tools for manually tracing less distinguishable features like hypocotyls or side roots.
Requirements
Software requirements
Java runtime version 6 or later is required. The JRE can be obtained from the java download page.
Hardware requirements
- 2 GB Memory (4 GB recommended)
- 1024x768 display resolution
Installation
Download the most recent RootDetection ZIP-archive from www.labutils.de. Unpack the archive into your favorite installation location.
The package contains executable binaries for all major platforms:
- rootdetection-xxx.app (MAC OS X)
- rootdetection-xxx.exe (Windows)
- rootdetection-xxx.sh (Linux)
Exemplary workflow with RootDetection
1. Preparation
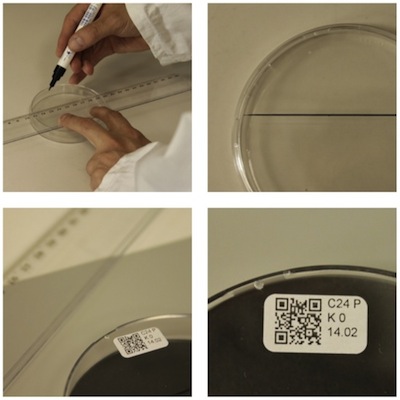
- mark petri dishes with measure line
- apply barcode labels
2. Perform experiment
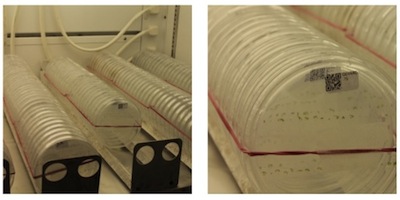
- proceed with experimental setup
3. Take pictures
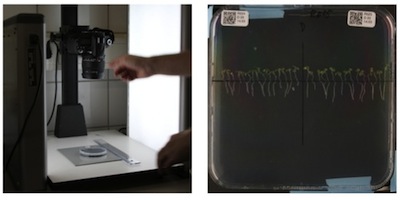
- take pictures of petri dishes with digital camera
4. Run RootDetection
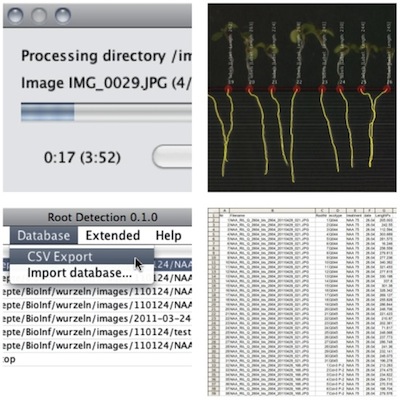
- run fully automated batch mode
- perform optional image post processing
- export data to MS Excel or access data with R package
5. Perform data analysis via R package
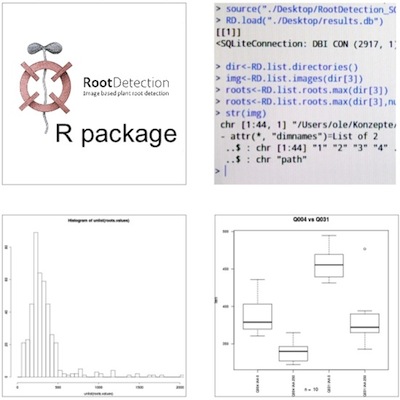
- connect to database with R package
- analyse and visualise data (histogram, boxplot,...)
(For more information please refer to the RootDetection R package manual).
Image requirements
Taking pictures / Requirements and Tips
RootDetecion can handle image files in JPEG format.
You can obtain suitable images from:
- Digital single lens reflex camera (DSLR)
- Digital camera
- Scanner
Requirements
Take a look at the example picture included in the ZIP-archive for proper image settings. You can also download the example picture set from www.labutils.de.
Things to remember:
- aim for high contrast between roots and background
- adjust light settings to ensure legibility of QR-code
- mark petri dishes with distinct measure lines, preferrably by using a template (to ensure more or less consistent positioning of measure lines)
More tips:
- use repro-stand with dark background and diffuse lighting
- avoid reflections on the picture
- avoid direct light on the picture
- increase depth of field (F/11 and higher)
- include scale on every picture (or retain same focal length and image distance for all images)
Menu Overview
Action Menu
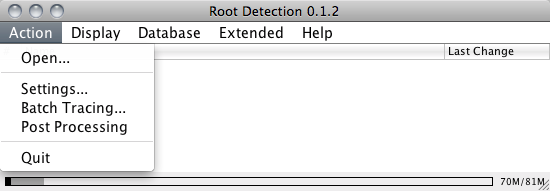
Action > Open...
The entry 'Open...' allows opening images and directories for post processing or manual tracing. If the database contains results for the selected file or directory, e.g. from an earlier batch trace, they will be displayed and can be adjusted.
Action > Settings...
The 'Settings...' entry of the 'Action' menu will open a file selection dialog and allows you to choose one examplary image in your picture folder for required image settings.
Action > Batch Tracing...
The entry 'Batch Tracing' opens a folder select dialog and allows you to choose the picture folder for a new batch tracing run.
Batch Tracing will use the settings specified in the config.properties file in that folder and will scan and measure roots automatically.
It will create a new 'output' folder within the picture folder to store reference images with the found roots in jpeg format.
Action > Post Processing
Choose your picture folder from the RootDetection table and start post processing to fix tracing problems or to relabel results.
When selecting this entry, the currently highlighted folder in the overview table will be opened for post processing. In other words - you cannot post process images or folders, that have not been batch traced before. If you want (or have) to avoid automatic batch tracing before post processing, you can use the 'Manual Batch Trace' mode in the 'Extended' menu.
Action > Quit
Quits RootDetection.
Display Menu
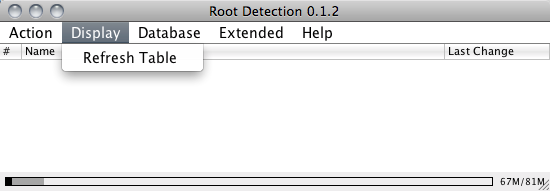
Display > Refresh Table
Refreshes directory table in program overview after database import or during Batch Tracing.
Database Menu
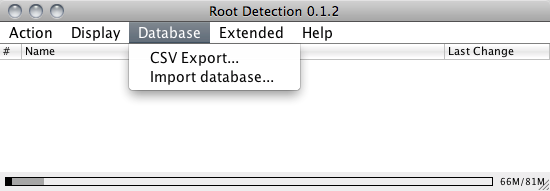
Database > CSV Export...
Exports the most recent results of the currently highlighted folder into a CSV file.
Choose the appropriate 'Files of Type' option to define the output style of the saved data:
- 'Grouped by Region' Exports all data grouped by the defined regions. (preferred for Excel import)
- 'List' Exports all data as a single list. (preferred for automated processing, e.g. with custom software)
Database > Import database...
Imports Database from other RootDetection installations and from older versions of RootDetection.
Extended Menu
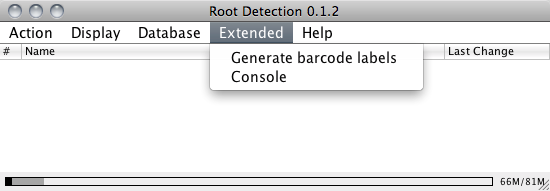
Extended > Generate barcode labels
Generates QR-code labels. These labels can be printed on label pads and can be used to automatically assign root detection results to experiment parameters, plant sets and other metadata.
Each line represents one label. The label will contain a QR-code encoding the plain text of this line. The QR-code is sized as large as possible to still fit the label. For increased usability, the plain text is then output into the remaining space. It is split into lines at [Tab] and [Semicolon] characters. This can be used to split the label data into different groups
Example:
Mutant1TabTreatment1TabDate
Mutant2TabTreatment1TabDate
or
Mutant1;Treatment1;Date
Mutant2;Treatment1;Date
Extended > Console
Opens the error console. The error console collects error and debugging messages of RootDetection and can sometimes contain helpful information when struggling with unexpected problems.
Help Menu
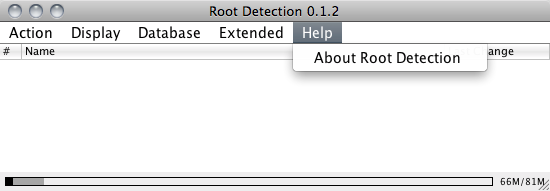
Help > About RootDetection
Shows the current RootDetection version.
Settings Window
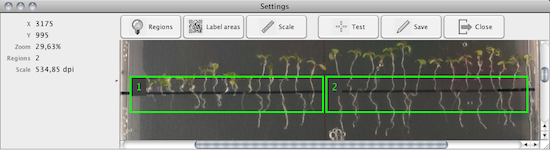

Regions
Defines image regions to be scanned. Usually an image contains up to 4 regions with different sets of plants. The definition of the regions allows RootDetection to assign each detected and measured root to be correctly assigned to the right set of plants.
- Click 'Regions' button
- Drag mouse for each region
- Click 'Regions' button again to end region selection
Label areas
Defines label regions. Each plant region (see above) can have an associated label area where the QR-Code label has been placed. This allows individual labelling of different plant sets within each image.
- Click 'Label areas' button
- Drag mouse for each region
Scale
Defines the image scale. This step is only necessary if you are interested in metric length values (mm). Otherwise all lengths values will be in pixels.
- Click 'Scale' button
- Drag mouse
- Input reference length in mm (no decimal places)
Test configuration
Applies the current configuration to the image. This quick test can reveal misplaced regions or label areas.
- Click 'Test' button
Save
Saves the current settings of image to the config.properties file in the containing folder.
- Click 'Save' button
Close
Returns to program overview.
- Click 'Close' button
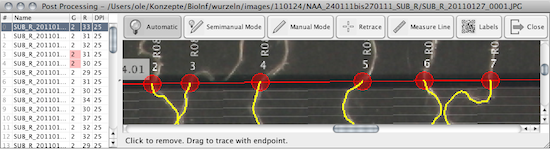
Post Processing Window

Keyboard Shortcuts
Viewing/Zooming
- f - Overview of complete image.
- 1 - Original size of image.
- + - Zooms in.
- - - Zooms out.
- b - Toggles background-only (removes markers etc.).
- g - Toggles anti-aliasing.
Miscellaneous
- TAB - Toogles between 'Automatic', 'Semimanual Mode' and 'Manual Mode'.
- Space - Toogles 'Grab' mode (see below).
- CTRL+s / CMD+s - Saves results to Database
Grab Mode: While pressing Space, you can click and drag the image to move the visible image area.
Introduction
The tools in the post processing window are context sensitive. Clicking on an existing start point will perform an entirely different action (removing that root) than clicking on an empty image area (adding a new root starting at that point). You can always refer to the helpful hints given in the status bar of the post processing window.
Automatic
This mode is the standard post processing mode. It allows for quick touch ups to the scan result (removing obsolete start points, adding missed start points, fixing incorrectly scanned lengths etc.)
- Left click on a start point removes it.
- Left click into an empty area adds a new start point and measures the root.
- Dragging an existing start point traces the root up to the defined end point.
Semimanual Mode
This mode involves a little more handywork but provides much more flexibility and better results with complicated root paths (lots of overlap, low contrast etc.) You can paint a blue scan region for every root which will be favoured when scanning the root path. This way you can prevent wrong turns, duplicate path traversals etc.
- Left click on a start point removes it
- Left click into an empty area adds a new start point. If you continue to drag the mouse pointer after the initial click, you can define the region in which RootDetection will scan for the root. The blue area is the region with the highest weight for the scan.
- Drag any other start point to trace with defined scan region and end point.
Manual Mode
The manual mode behaves exactly like the Semimanual Mode, except that the drawn path is used AS IS for the root. No further scanning or tracing is performed. This mode is intended to be used for very complicated or undistinguishable root paths.
Retrace
The 'Retrace' function will retrace the complete image. Actually, we hardly ever use this feature at all. But you might find it useful.
A 'Please select' window will appear, offering three options:
- Keep start lines will keep the existing measure lines.
- Discard start lines will discard current measure lines and initiate an automatic scan for measure lines.
- Cancel will cancel the 'Retrace' function.
Measure Line
Drag and drop end points of measure line to adjust them.
Labels
The 'Labels' function will open a window to adjust the label text of each region. This is helpful if the QR-code scanned could not detect the QR-code (or if you haven't used any...).
You can manually input the text for each region.
In the window you have three different options:
- Scan will rescan the defined label regions.
- Cancel will cancel the 'Labels' function.
- OK will save your manually entered text changes.
Close
Returns to program overview.